Table of contents
Kuma is a CNCF Sandbox project which was developed by Kong.inc which is known for it's API gateway with Advanced Service Mesh solutions. With the modern microservices application structure the combination of multiple APIs and gateways to control the logging, authentication and authorization of APIs.
The world of service mesh can feel like wrangling a complex beast. But what if you could tame that complexity and achieve multi-zone service mesh management with ease? Enter Kuma.io, a rising star in the CNCF Sandbox that's bringing simplicity and control to an Advanced service meshes.
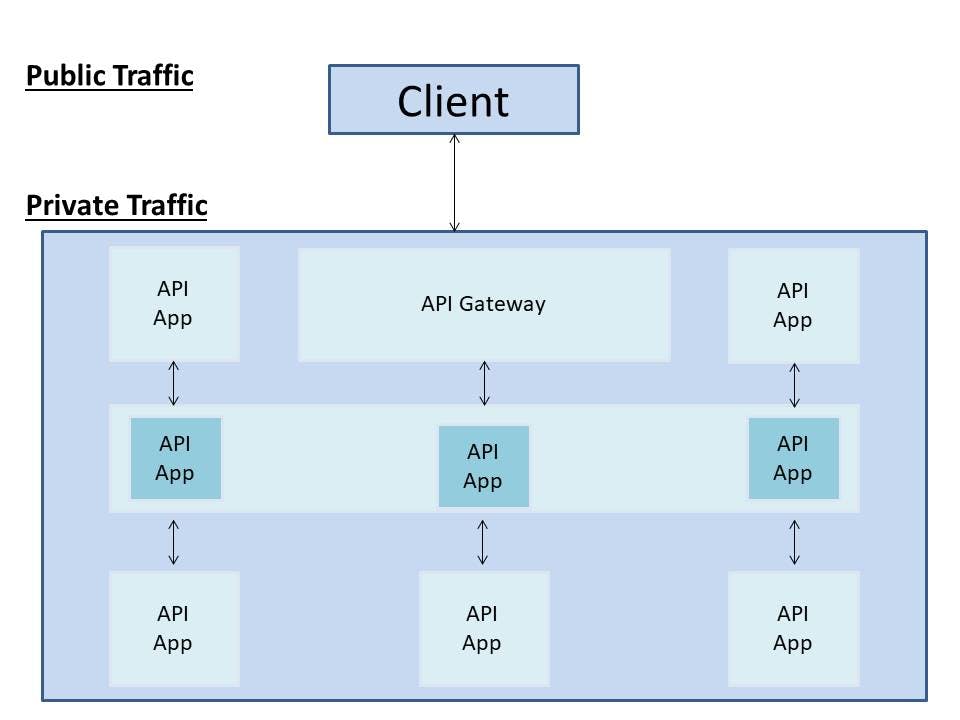
Thus, API gateways were the only pass away to control these many APIs. So we needs to handle traffics from outsides to inside which sounds similar to Kong Gateway. So this is pretty good in case when the project isn't that huge and the number of APIs cross nearly 5-10 APIs.
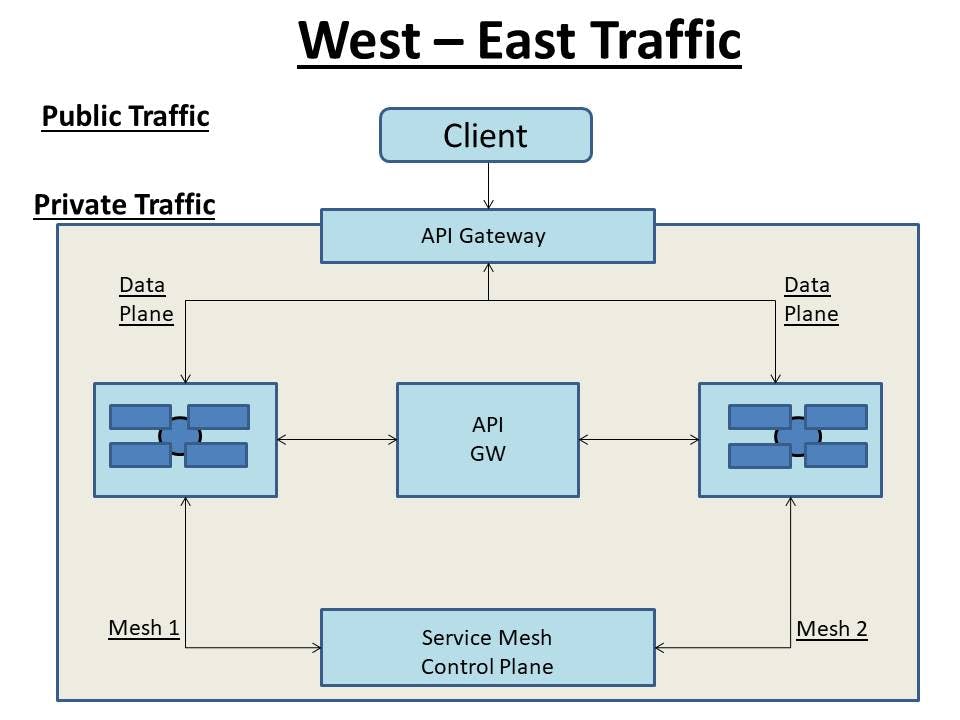
In case, we manage 10,000s of APIs where new APIs are being added everyday then the "Service Mesh" is used by us to manage the traffic between the APIs inside the cluster which is also known as West-East Traffic.
So to manage traffic inside our cluster in West East traffic Kong Mesh can be used. To manage traffic from outside we can use Gateway API which is called as Now Source Transaction.
Now, here when we talk of the Data Plane in the Service Mesh which takes control of the pods to manage the traffic between the pods and across different clusters.
Service Mesh
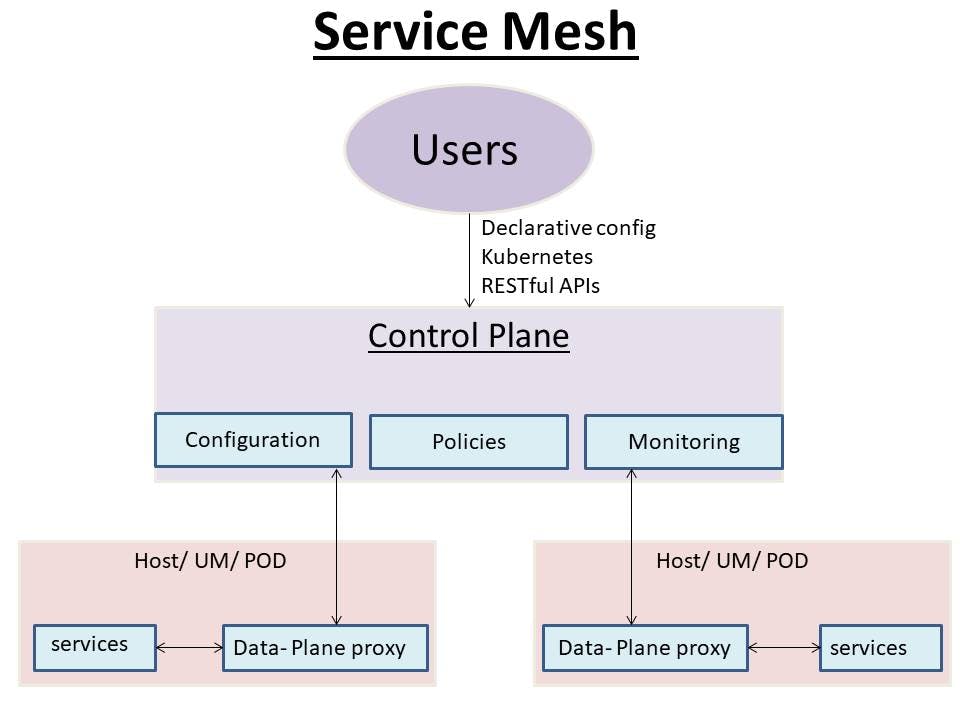
Now in the Control Plane, we can do configuration to send some new configuration to the data plane proxies and set some policies to add some logging, rate limiting, thus these policies in control plane can be used to automate data plane.
Monitoring
Now, the control plane as we know takes control of the whole cluster which will report the matrix information on sending traffic or the logging information to the control plane from where control plane will expose these matrix and login information to third party platforms like Prometheus or Data Dog after which developers can add some configurations to add new CRDs (Custom Resource Definitions).
Kuma's difference from Istio
Different services has a team of developers and the services need to communicate with the other services, now the teams have to focus on some of the common things like connectivity, logging, authentications and may other things which are taken care of by Kuma, so that developers can only focus on the development about the main core features of their APIs while the login, authentication, rate limiting, load balancing is taken care by Kuma.
We can also put these layers upper and put the common tasks been taking care of by Kuma in the Service Mesh layers. So, we don't need to control and do eliminate out the repetitive task.
Kuma-Standalone
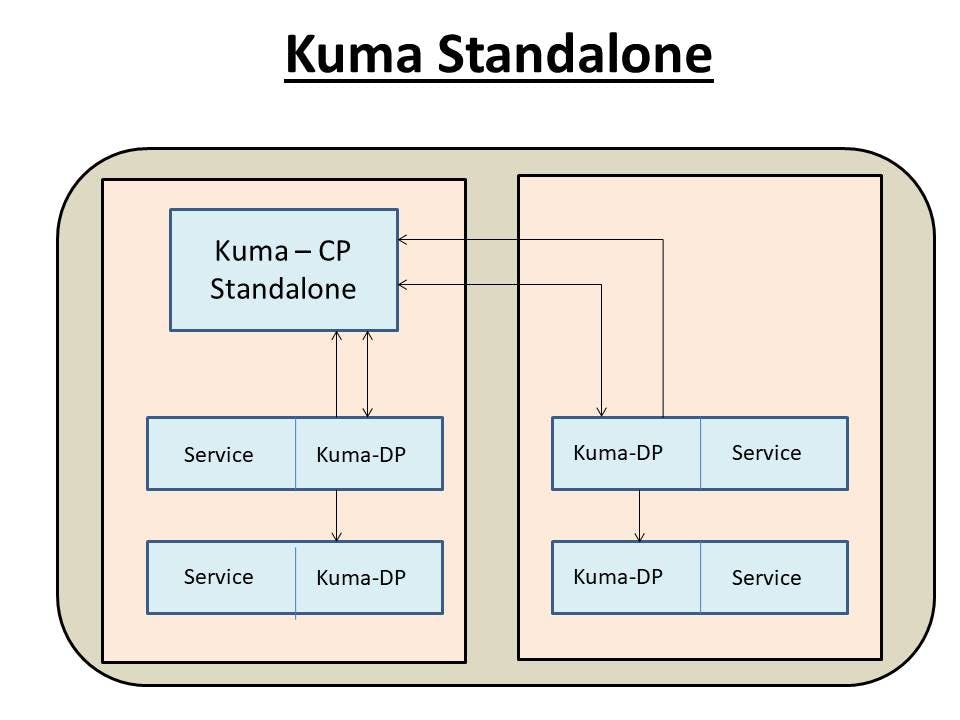
In Kuma-Standalone, we have one control plane and each service we have one data plane as a sidecar which will report to control plane then control plane will put the new configuration to data plane. This is useful where Kuma is available only in one cluster.
Kuma-Multiple Zone
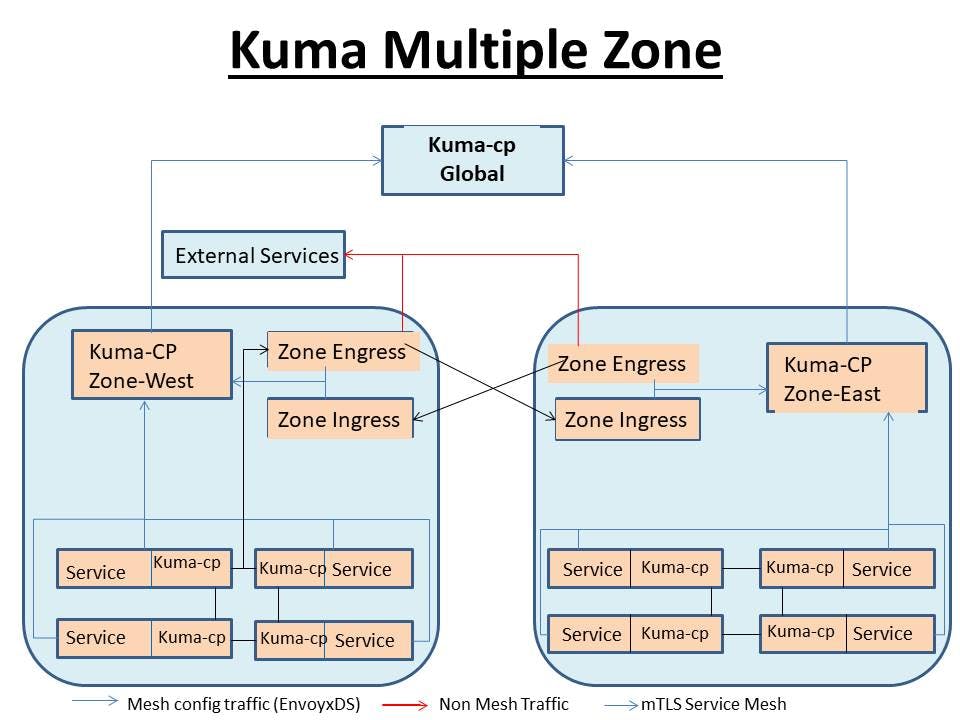
Here we have global and zonal control plans, so we can have multiple isolated service mesh for our each cluster. Thus, Kuma isn't only limited to Cloud Native but also available for Virtual Machine (VM), bare metals and other development environments. here in the structure we haev seen a Zone-Ingress and Zone-Engress where:
- Zone Ingress :
Acts as an entry points for traffic into a specific zone within the Kuma Service-Mesh. It is responsible for routing in coming traffic from external sources to appropriate service within the zone.
- Zone Engress :
It manages outgoing traffic from services within a specific within a specific zone to external destinations. It handles routing required from services within the zone to external endpoints, such as external APIs or services outside the mesh.
In these zones, Kuma will find the common similar services and features in the zones, such that if one of the service fails and is not available then will handle the similar service in the other zone to pass and manage the failed ones.
We can even credit our own Kuma Mesh for multiple region and then combine all of things in one global control plans which will reduce the cost for management and operations.
Kuma Policies
Policies means we can use some new features in the Service Mesh level without changing anything for your service code. So, with Kuma we can use mTLS, Service ACL, routing, tracing, logging, CRD+REST.
Currently Kuma has more than 20 policies which can be implemented by writing commands. So, once the policy is applied then it will be pushed to control plane which will push settings to the data plane and then accordingly data plan will act according to it.
Open Telemetry & Kuma Integrations
Open Telemetry
Open Telemetry is a collection of tools which can be used to export the tracing data for your software. We can have a brief view of how time will have to be donated for any application and also view which part of the application will be taking how much of the time adding up to which our total time taken for that application is been reported which will enhance for performance increase monitoring and can also help in security aspects to view which part is acting weird and might the reason behind the bug traced.
Kuma collaboration with Open Telemetry
Lets say we have a very very very complicated and huge infrastructure of application which is starting to act shower compared to earlier which could be done in traditional way by engineers through Wireshark, to view which traffic is coming at what time, until what time and directed to which part. On the other hand with Open Telemetry along with Kuma, it's very easy to trace which part has issues directly instead of the earlier traditional tedious approach of mapping out and tracing the traffic.
Mesh Trace Policy
Mesh trace is the CRD use in Kuma to trace using Open Telemetry. So, we can create the Mesh Trace policy to output which mesh we want to get the tracing data, as we have multiple Service Mesh combined with each other with a lot of different service allowing proper management of services and then later find the security defects through Mesh Trace with Kuma.
yaml_file example
apiVersion: Kuma.io/v1alpha1
kind: MeshTrace
metadata:
    name: default
    namespace: kuma-system
    label:
        name: default
        namespace: kuma-system
        label:
            kuma.io/mesh: default
        spec:
            targetRef:
                kind: Mesh
            deafult:
                backend: OpenTelemetry
                -   type:
                    OpenTelemtery:
                        endpoint: otel-collector:4317
Here the otel-collector is the open Telemetry collector for the tracing as Kuma doesn't directly send the tracing data to platform unlike NewRelic instead, Kuma used on Open Telemetry collector to collect the tracing data first and then send the tracing data to the vendors, because collectors have multiple features as with multiple tracing parts with multiple tracing parts with multiple zones tracing to vendors, use the OTL collectors to collect all of the information into one collector.
Open Telemetry have the ability to get tracing data to different vendors like Honey Comb, Jagger and Newrelic.
Use cases
Making Proxies
Here firstly, we will brought our collector_yaml file ready with all the endpoints and protocols listed in it to be applied, which will later send API keys to it.
We can do more things in the collectors like having multiple pods like gRPC and HTTP pods to receive the Open Telemetry data. Now, we will make new application and make it join to our Service Mesh cluster:
# create namespace
create ns mesh4devs

# To add new application to Kuma just LABEL IT !!
label ns mesh4devs kuma.io/sidecar-injection='enabled'
Now over here we added a new label as a sidecar-injection to our microservice. Now, after this enabling everything in this namespace will be injected in a sidecar which will take care of the traffic from the Pod.
# To create 2 services and 2 deployments
kubectl apply -k ./kubernetes -n mesh4devs
kubectl get all -n mesh4devs
Now here we can see there will be 2 containers in this pod i.e. application, it's sidecar and Service Mesh sidecar. Now to expose this information to the outside world and application we will use the Ingress with the name ingress.yaml .
# Now here we have pods, services, proxies and ingress as well to expose it.
kubectl apply -f ingress.yaml
How to use Mesh Tree to export Open Telemetry information
So we might be having an otelMeshTrace.yaml to label which Open Container vendor is, it supporting like Honey Comb, NewRelic, etc.
less .otelMeshTrace.yaml
In this yaml file we will observe in the backends with type: OpenTelemetry and below this type will be an endpoint to which the Kuma will send it's request to and this Open Collector will send it's data to outside i.e. Honey Comb outside of the cluster.
kubectl create -f otelMeshTrace.yaml
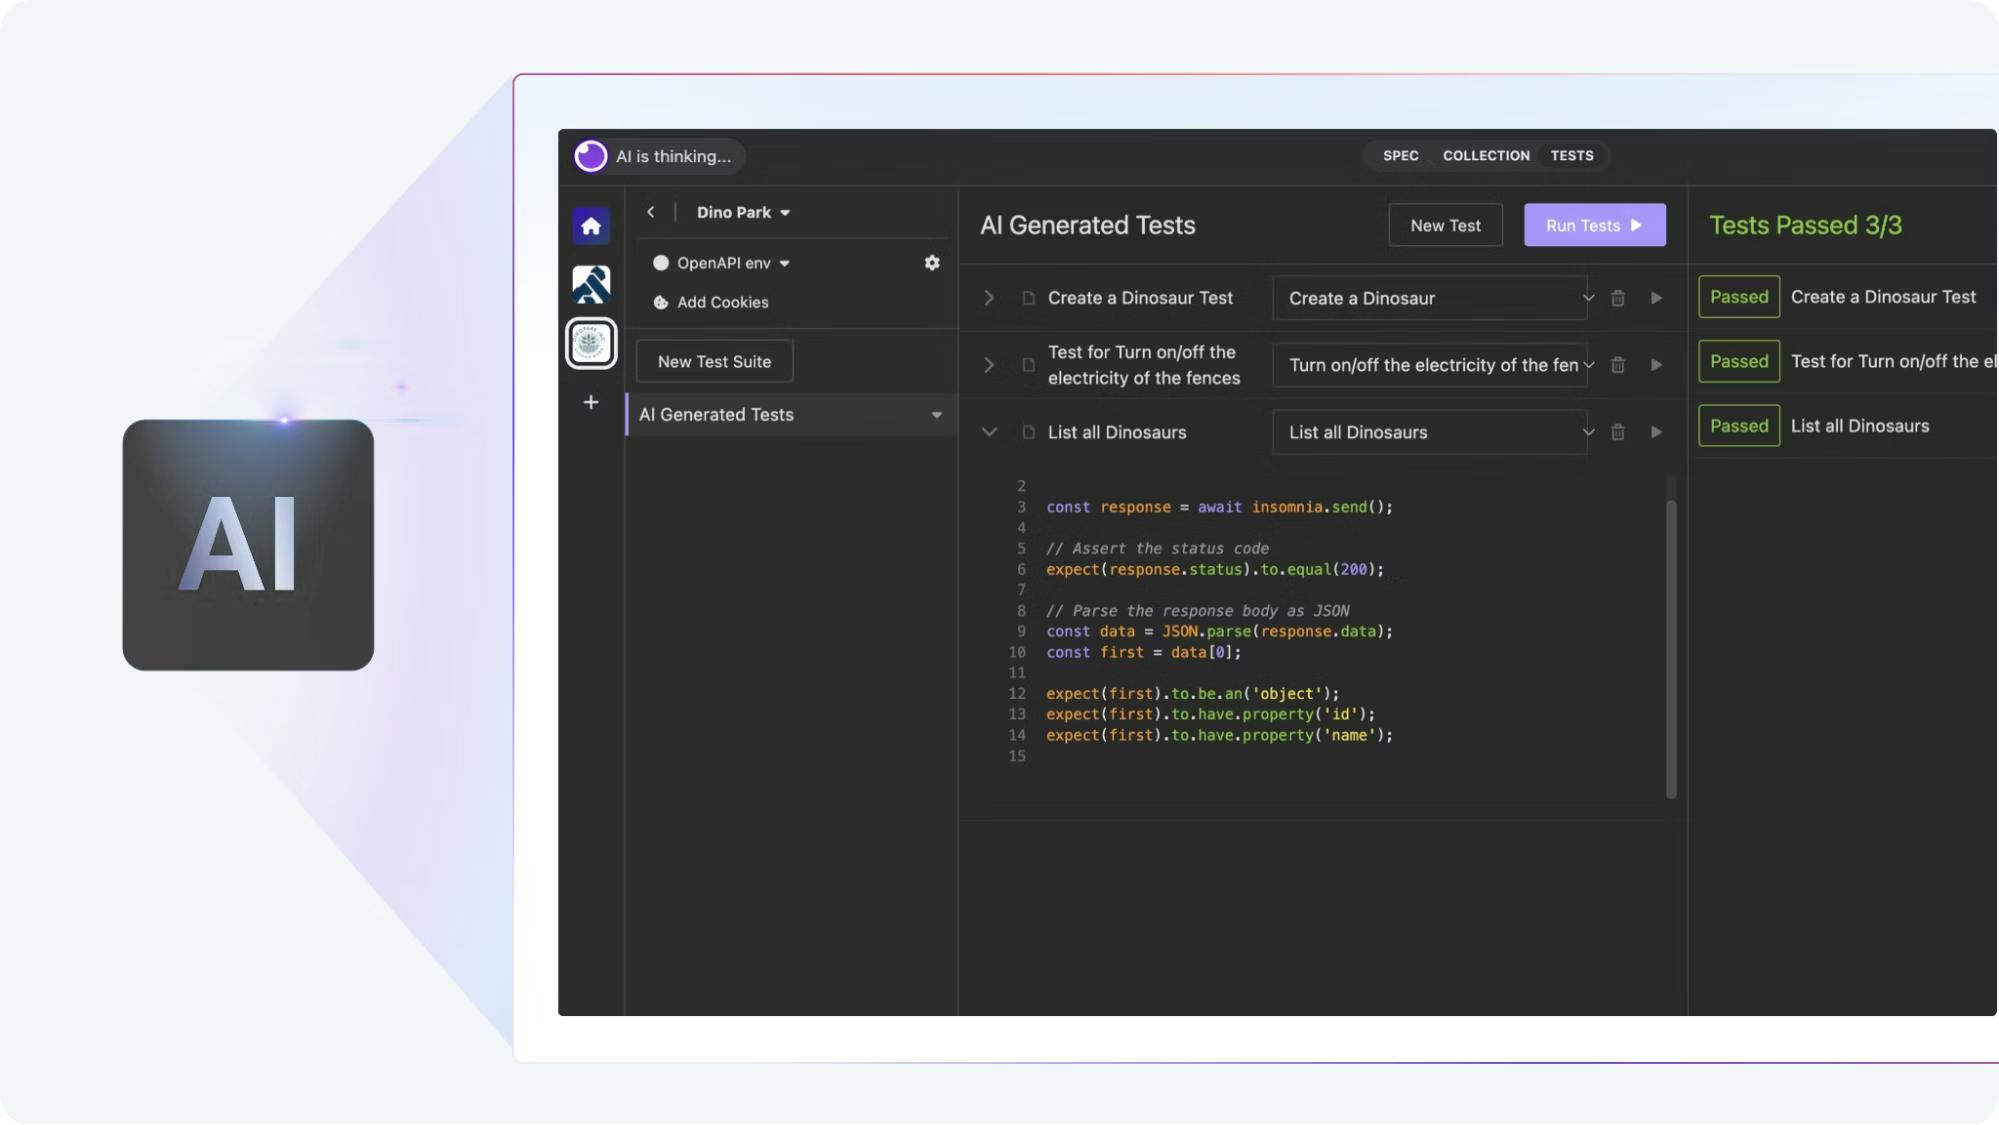
Now further we can mix some traffic with it to generate some tracing information for which we can use the service: Insomnia to send traffic of sending HTTP requests after a specific time of 2 seconds, 1 second, 0.5 second or whatever besides, we can also have other endpoints like elf, Jaggers, NewRelic.
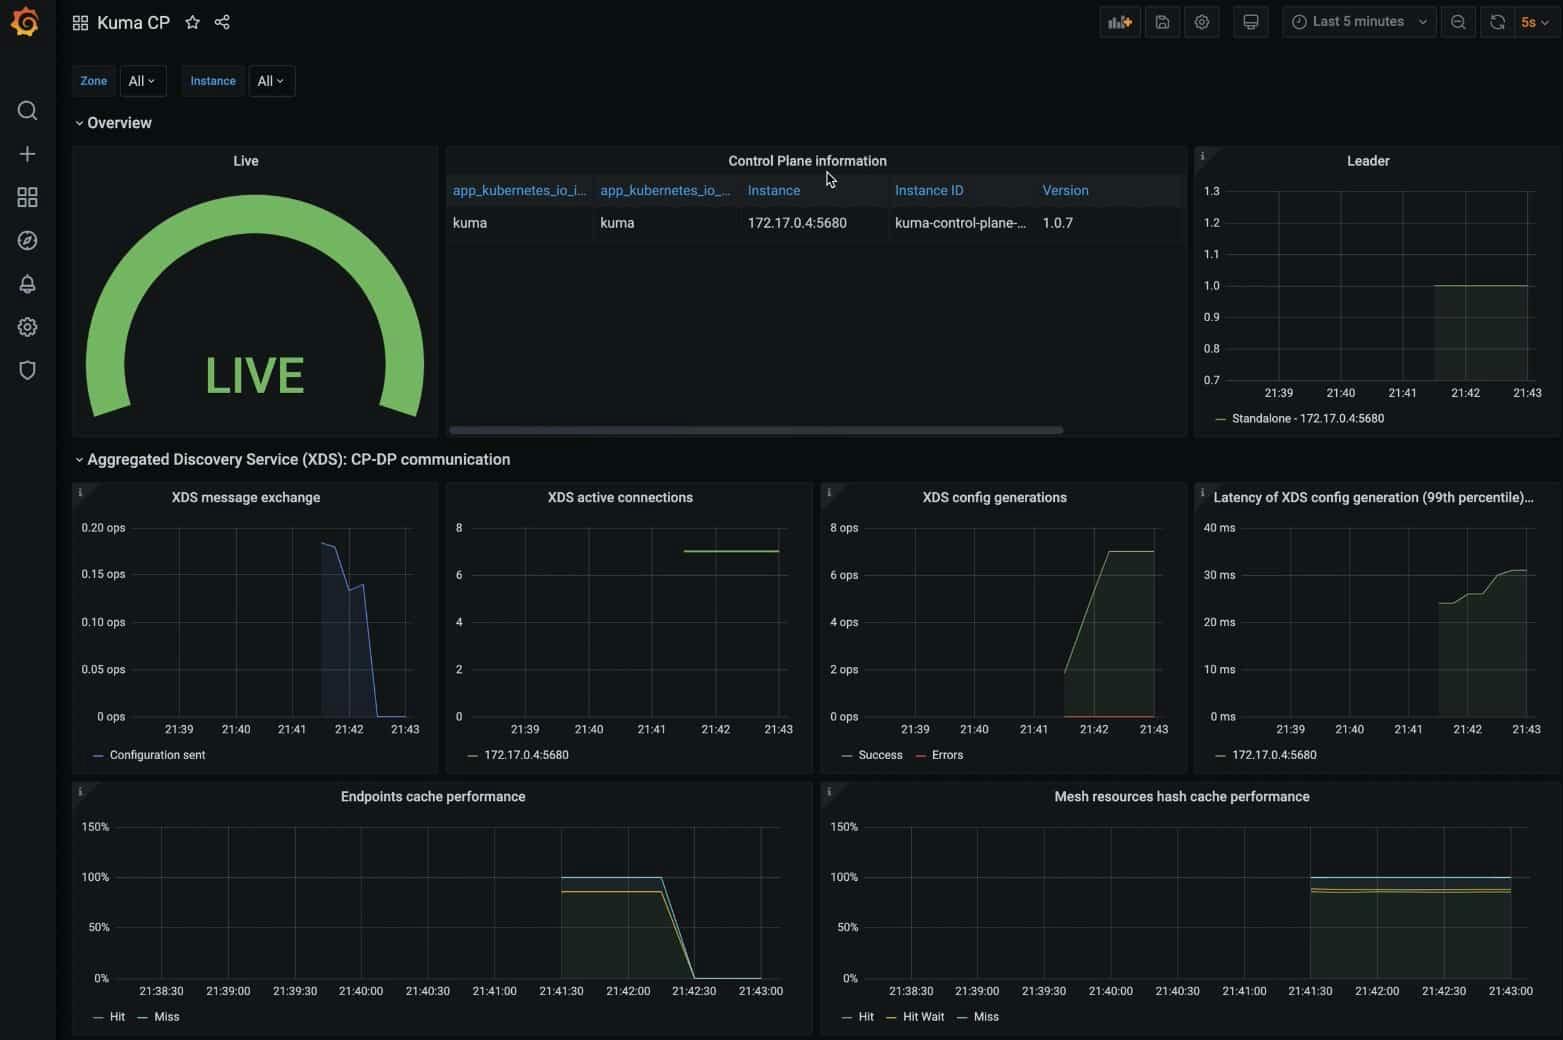
Now, we can head on to Honey Comb of the endpoint for the Open Telemetry information and then we can see the details for our Tracing and how much of time our application cost and sub processes.
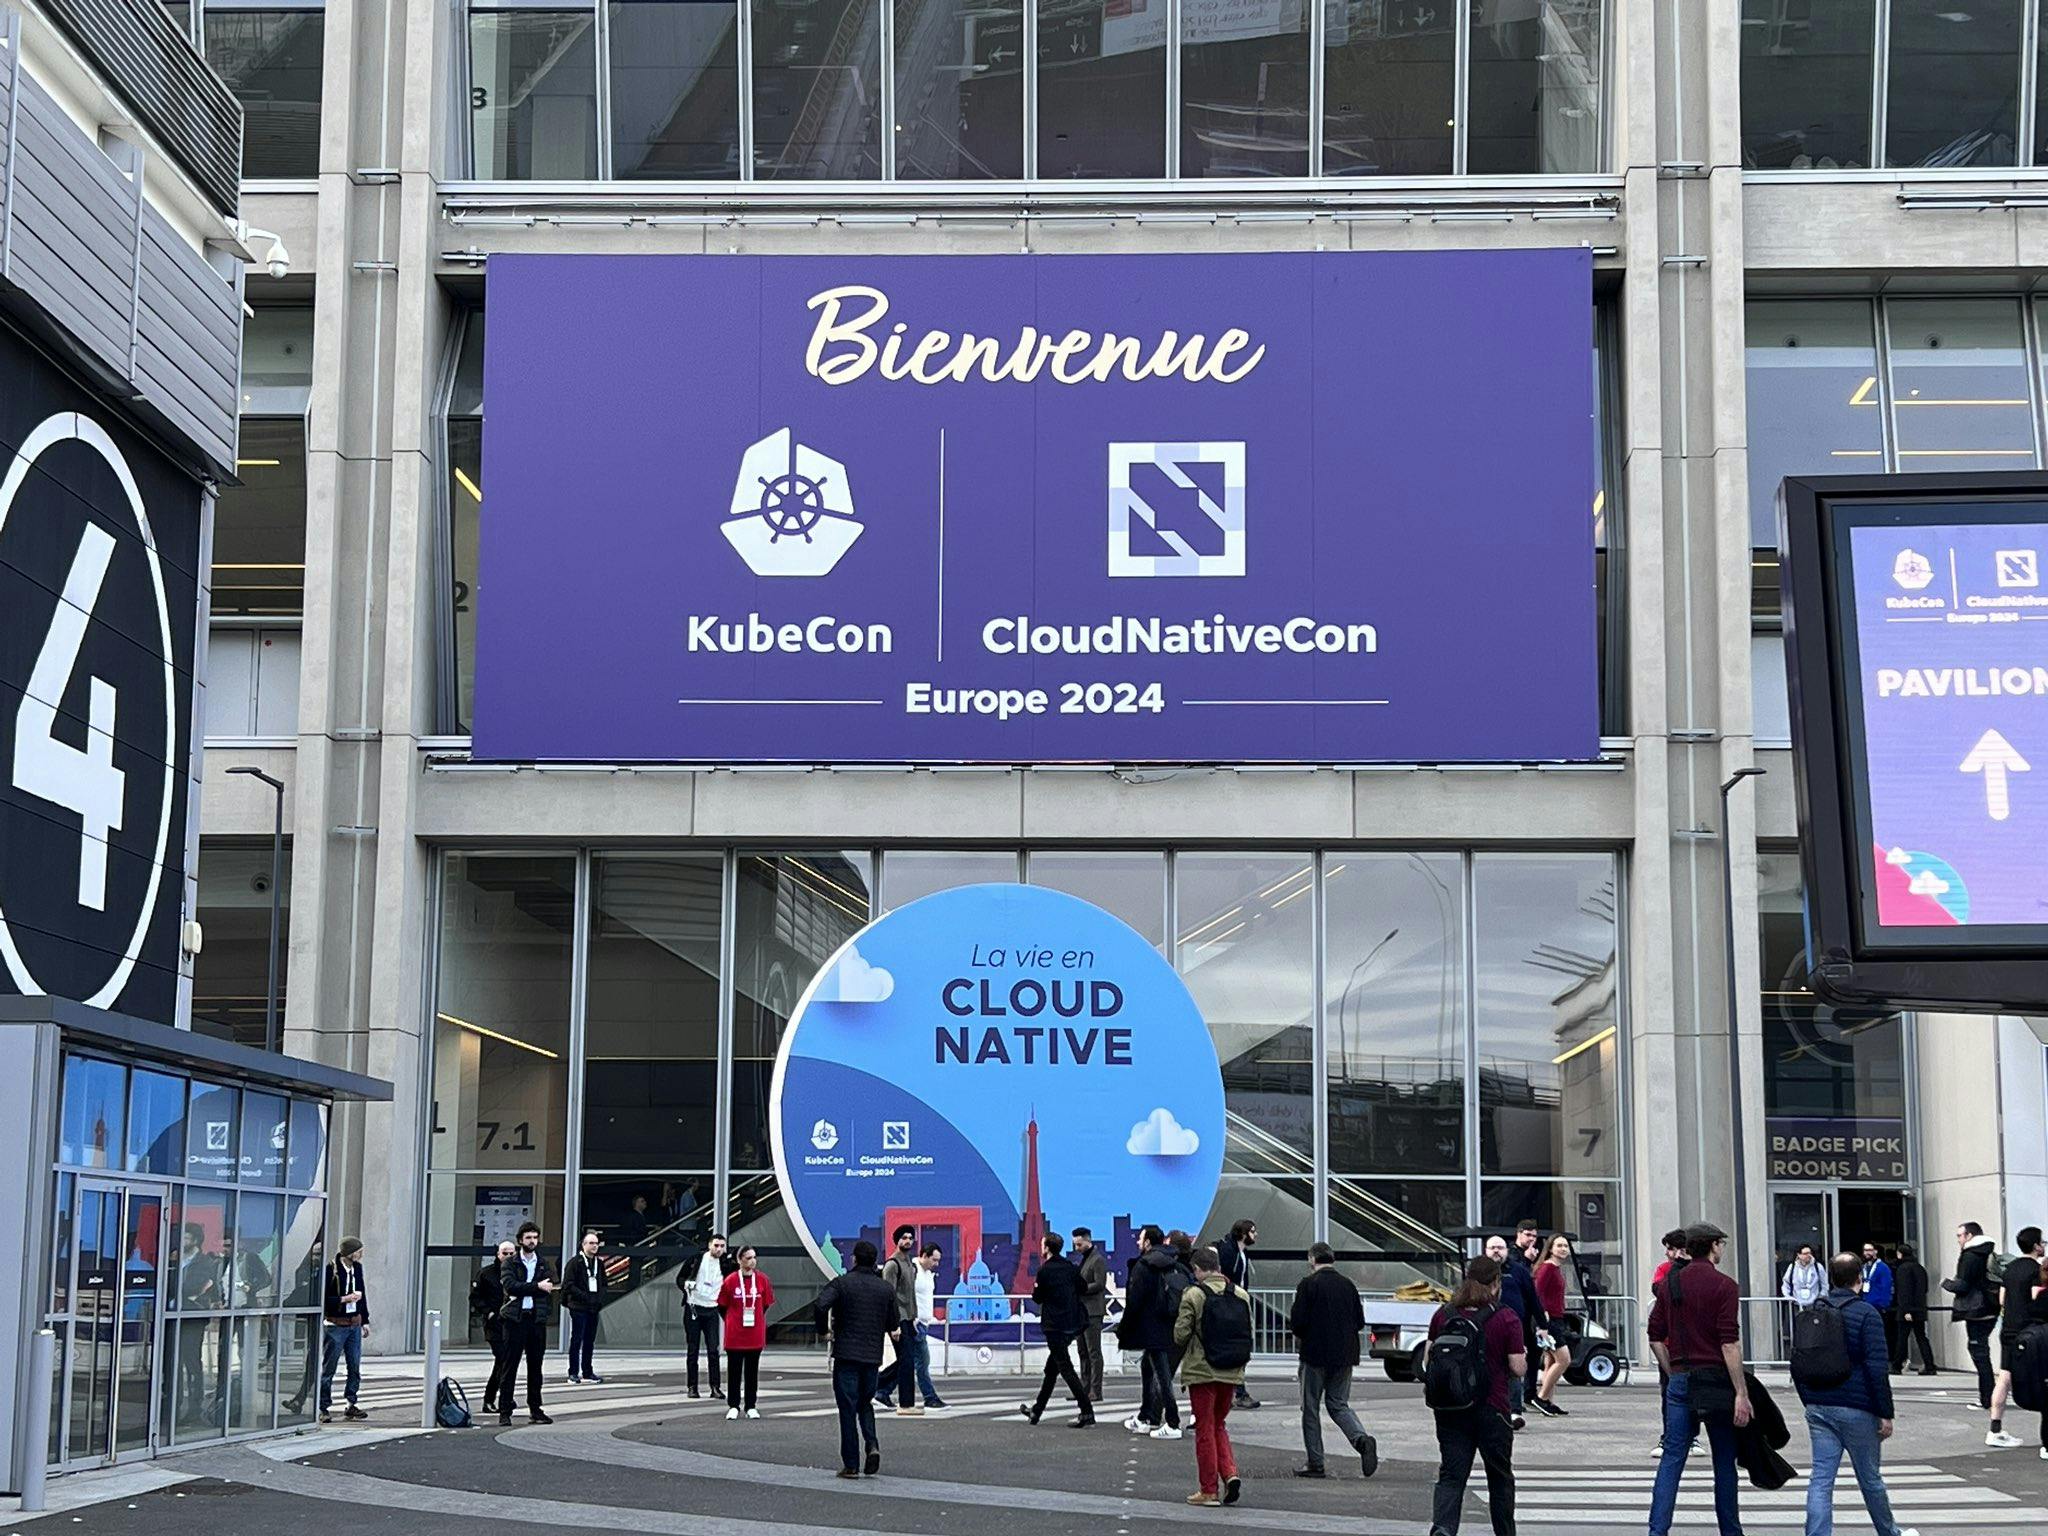
Even Kuma organized a local chapter at KubeCon Eu in Paris on 19th April 2024 which we can have a look at through the Youtube or even have the keynotes through their official pages and Linkedin page.
Hope you get to know something new about the Service Mesh & Kuma by Kong. Soon, I will be releasing more Service Mesh services with better use cases and all the other CNCF projects which hold up their events on the 19th March 2024 at KubeCon, Paris.
If you like my Article then please react to it and connect with me on Twitter if you are also a tech enthusiast. I would love to collaborate with people and share the experience of tech😄😄.
My Twitter Profile:
