
Kepler 🛰️: Sustain your Kubernetes & Cloud Workloads to reduce CO2 Consumptions


Kepler is a CNCF Sandbox project to measure energy consumptions to minimize the environmental impacts of workloads on the Cloud and identify the possible scanerio to figure out the opportunity to reduce the CO2 emissions. It uses eBPF to probe energy related system stats and exports as Prometheus metrics.
It is a tool to manage your consumptions of applications which is a partnership between IBM and Red Hat. Efforts are being made to export Kepler Matric with Open Telemetry especially on edge case. Now, there are huge efforts been taken by the huge organizations and even the European Union (EU) have been taking alot of steps to cut short the unnecessary consumption of CO2 or carbon emission and for a lot of AI workloads to tackle the main problems like:
How to manage energy consumption indirectly on cloud ?
How to measure energy consumption of workloads ?
How to attribute power on shared resources to process, containers or pods ?
So now it's much important to keep the track of the CO2 emissions as the emissions aren't linear as it depends on usage and what are the energy sources so that we can plan out to reduce them.
Kepler Projects:
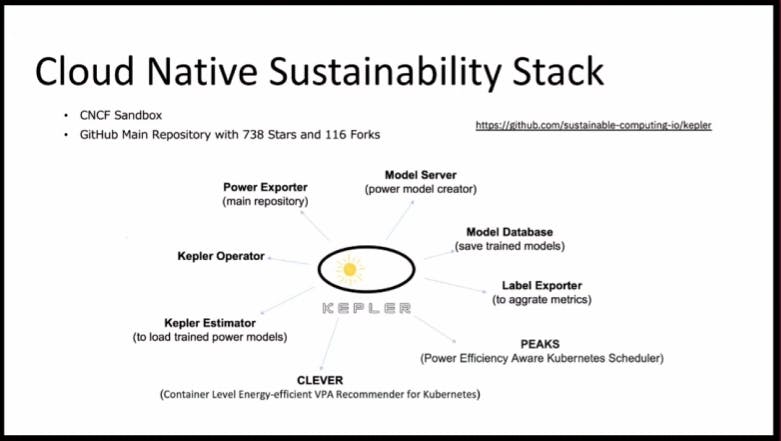
Here it list various projects of Kepler with different functionality and usage like:
Model Server: This project appears to be the main repository for the project. It likely trains models for power usage.
Power Exporter: This project extracts power consumption data. It is the main repository of Kepler project.
Model Database: This project stores the trained power usage models. It is used to create models for the public cloud where we don't have real time power matrix.
Kepler Operator: This project might be responsible for managing the Kepler components and their deployment.
Label Exporter: This project collects metrics related to resource consumption.
Kepler Estimator: This project appears to use the trained power models to estimate energy consumption.
PEAKS (Power Efficiency Aware Kubernetes Scheduler): This project is likely a Kubernetes scheduler that takes power efficiency into account when scheduling pods.
CLEVER (Container Level Energy-efficient VPA Recommender for Kubernetes): This project recommends Vertical Pod Autoscaler (VPA) settings that optimize energy use for containers in Kubernetes. It dynamically changes the CPU frequency to save energy for workloads and picks with Kubernetes schedulers to be aware about the energy consumptions in workloads and CO2 emissions.
At different times, difference in CO2 emission can be seen at different locations so, the scheduler can find the emission in a big cluster.
Kepler : Kubernetes based Efficient power level Exporter
Kepler is a Kubernetes based efficient power level exporter which was initially built for Kubernetes btu now, it can be used as a standalone. It uses software and a hardware counters to measure power consumption by hardware resources and export as Prometheus metrices.
It's use for resources utilization for the process level and power consumption of hardware in the bare metal. Power models are used when the power consumption is in the environment as it's much hard to track.
Features/ Premises
Reporting
Main features of Kepler is reporting the energy consumption which can also be connected to power as well:
Per pod level energy consumption reporting including CPU/ GPU, RAM.
Support bare metal as well as VM.
Support Prometheus.
It has comparatively lower overhead and uses the eBPF to collect Matrix form the process.
Kepler has resources utilization, low at scale and also overhead introduction in other applications which runs on Kepler is low as the monitoring which can also introduce some overhead.
How does Kepler distribute Power ?
So, lets say if a process is using only 10% of CPU, 10% of energy consumption of CPU utilization can be founded out differently i.e. by CPU time. If we have harder counters, instructions cache and a lot of other components to determine CPU utilization but just to say in general, their CPU utilization is linearly related to power consumption.
Kepler Architecture
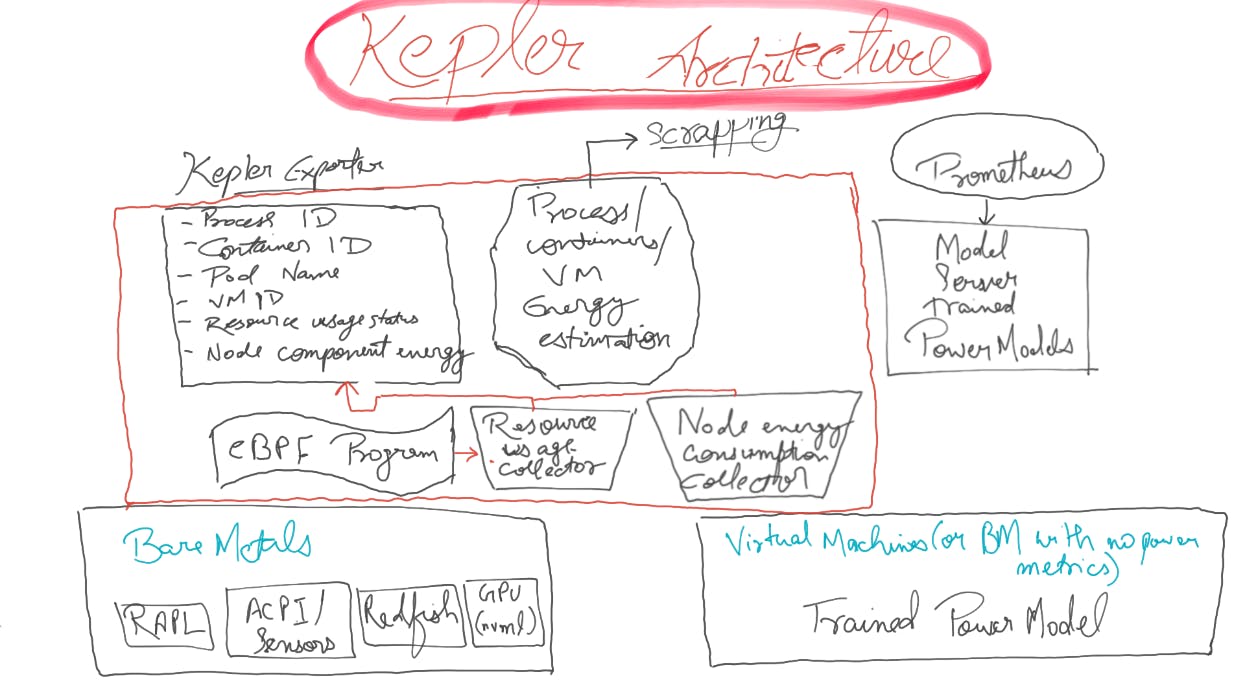
Kepler is natively integrated with Kubernetes, which match Kubernetes server to get information about the pods, to use that to aggregate matrix, pod names, container IDs from API server.
At the server side, Kepler is a daemon set which runs in each node, monitoring all the processes to get the process ID, container ID, pod names and all the information which can be aggregated by user for power/ energy consumption using prometheus matrix.
We can collect the information about the eBPF matrix, power consumption of bare metals from the sensors.
It can use a trained power model if it's a virtual machine which is created by model server.
Kepler Deployment Approaches
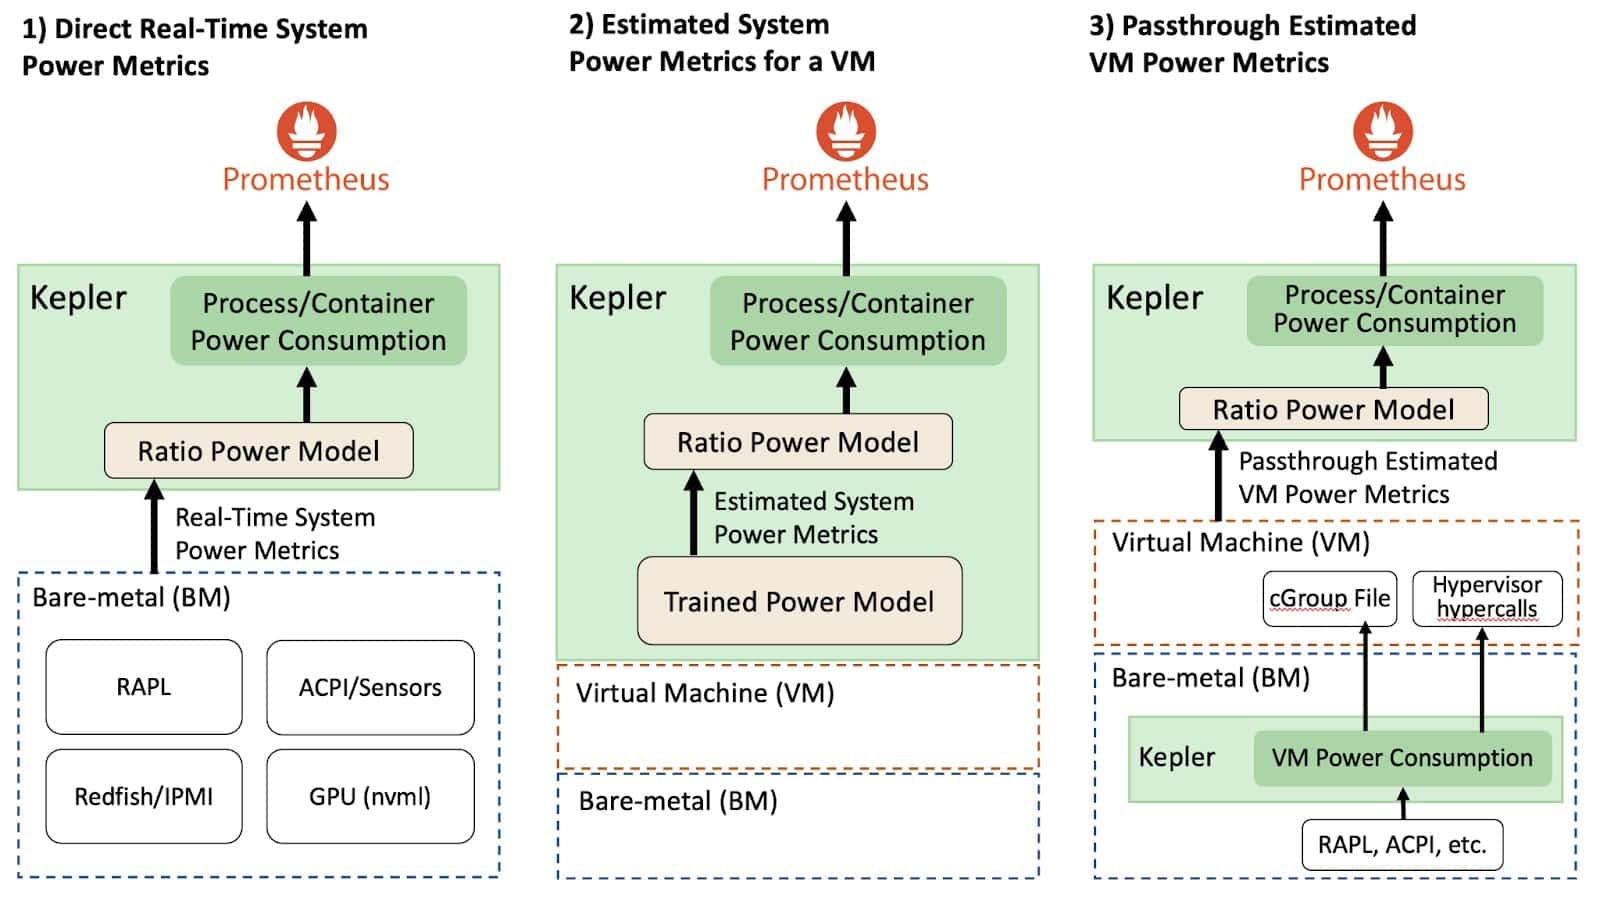
Bare Metals used sensors to deploy purposes to use power model to deploy purposes to monitor these power consumption through Prometheus. Although, it isn't that easy for the Public clouds and Virtual Machines as they doesn't expose Power Matrix from within your VM.
Although, in future they can have Power Model but that will be through Trained Power Model which will surely have many limitations and will depend on user requirements.
Kepler is already on Bare Metals so we can measure energy consumption of VMs and expose their Power Matrix, even it can be runed with Kubernetes on top of it.
The main advantage is that, it isn't using prediction but the real energy consumptions from the Bare Metals and then you can expose the idle power. Since CPU utilization isn't linear with all CPU architecture thus Kepler is flexible to get architecture of CPU through community help to expose the CPU and energy utilization.
Kepler Model Server
It's use is to collect matrix for power consumption for this VMs that doesn't have real-time power model Matrix thus, we have to predict it somehow and also provide power by workloads.
Model Server have the CPU core and Dram Energy consumption Model to ensure the params of CPU architecture, while if the CPU architecture isn't available then it will use some generics power model which does necessarily fits all types of CPU.
It's also the GET method of Prometheus which runs with main Kepler Daemon set but is use to train which is another daemon to collect matrix from Prometheus to do the training and export the power model later to estimate.
Kubernetes and Beyond
Kepler which was built for the Kubernetes in the starting btu it has now moved beyond Kubernetes to on-edge and then now it can be used at standalone.
For standalone, Kepler RPM is used to run on red hat systems on Linux VMs or bare metals to collect the power matrix and exports.
Open Telemetry integrations for the Edge
While working on Edge, it's very expensive to use Prometheus and Grafana thus Open Telemetry would act as better choice and also where we can connect to the connection data hub where we have our full observability stack with Prometheus data source and an amazing Grafana dashboard.
Thus Open Telemetry have played a really vendor agnostic role in bringing together a lot of integrations of observability community together and it doesn't have to funnel off to the observability vendor and at the edge you might want to collect all of our kepler data to aggregate together like a remote central location where we can press and manage it.
OpenTelemetry Collector
Kepler can brings Open Telemetry Collector which can run as a side car to Kepler daemon set. It can also work as a container with systemd .
Currently, Kepler is instrumental for Prometheus at the edge as:
lightweight & flexible
Open, vendor agnostic
Sidecar, central deployment, container or RPM with systemd
Recently, efforts are being performed for Prometheus receiver embedding in the SDK to directly use the OTP matrix but for now it's Prometheus receiver in use.
OpenTelemetry for Edge
Single connection point from each of your edge devices to funnel up your metrix to central observability stack with more features.
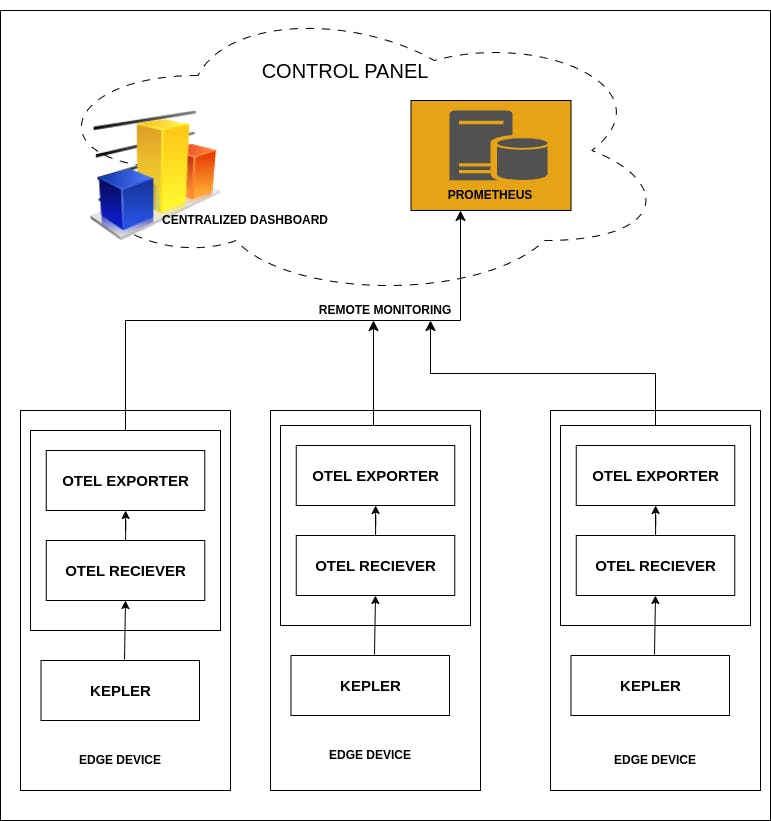
So Centralized Dashboarding is an initiative going on with Kepler project. For example:
microsoft version

oc get pods -A
Now it will provide with all the pods with all the resources and services like drs, storage, services and a lot more. Then we will set up the Mutual TLS with the Kepler and set up as the RPM running on a local edge machine with which we can also use Prometheus Reciever and the expert can be Kubernetes cluster having fall featured observability stack. Then we can move forward to Grafana to view Prometheus & Kepler observability. We can even see all the metrix were explorable with the Prometheus data.
Kepler's power monitoring capabilities open doors to a variety of valuable use cases within cloud-native environments. Here's a detailed breakdown of its potential:
1. Fine-grained Energy Efficiency and Cost Optimization:
Pod-Level Power Measurement: Unlike traditional tools that measure power consumption at the machine level, Kepler provides granular insights into power usage by individual pods within a containerized application. This allows for:
Identifying resource-intensive pods: By pinpointing pods with high power consumption, users can optimize deployments. For instance, scaling down resource allocation for less demanding pods or containerizing applications with lower power requirements.
Cost allocation by workload: With power consumption data mapped to specific pods, organizations can accurately allocate cloud resource costs to different projects or departments based on their actual usage.
2. Comprehensive Sustainability Tracking and Carbon Footprint Management:
Power-to-Carbon Footprint Conversion: Kepler's power usage data can be coupled with regional carbon intensity factors to estimate the carbon footprint associated with cloud workloads. This enables organizations to:
Track and report on their cloud sustainability efforts.
Make data-driven decisions to reduce their environmental impact. For example, prioritizing workloads that can be migrated to renewable energy sources or implementing power-efficient coding practices.
3. Intelligent Capacity Planning and Resource Optimization:
Power-Aware Kubernetes Scheduling: Kepler's metrics can be integrated with Kubernetes schedulers to place workloads on nodes that offer the best performance per watt. This allows for:
More efficient resource utilization: By considering power consumption alongside traditional factors like CPU and memory, workloads can be placed on nodes that deliver optimal performance while minimizing energy usage.
Right-sizing cloud resources: Organizations can avoid overprovisioning by accurately estimating the power requirements of their workloads and allocating resources accordingly.
4. Proactive Anomaly Detection and Performance Troubleshooting:
Monitoring for Deviations in Power Consumption: Unexpected spikes or dips in power usage can indicate problems within applications or infrastructure. Kepler's monitoring capabilities enable:
Early detection of performance issues: Deviations from expected power consumption patterns can signal inefficient code execution, hardware malfunctions, or resource bottlenecks.
Faster troubleshooting and issue resolution: By pinpointing anomalies, developers and operations teams can quickly diagnose problems and take corrective actions to improve performance and energy efficiency.
5. Seamless Integration with Cloud-Native Toolchain:
Visualization and Analysis alongside Existing Metrics: Kepler integrates with popular cloud-native tools like Prometheus and OpenShift. This allows users to:
Visualize power consumption data alongside other application metrics within familiar dashboards and monitoring tools.
Correlate power usage with performance metrics to gain deeper insights into application behavior and resource utilization.
Development Status: It's important to remember that Kepler is still under development. While core functionalities are available, some features like highly customized power models might require further development.
Community Involvement: The CNCF fosters collaboration on open-source projects like Kepler. Active participation in the Kepler community allows users to contribute to its development, shape its future direction, and access the latest advancements.
I hope you learned a lot through this blog about Kepler, soon I will be sharing a lot more about the good use cases setting up the environment and more projects taking place in the Cloud Native Computing Foundation Landscape. Soon I will eb releasing an in-depth video including all the insights, setting up environments, good use cases on my YouTube channel, so in case you aren't subscribed then just give it a look 😄.
If you like my Article then please react to it and connect with me on Twitter if you are also a tech enthusiast. I would love to collaborate with people and share the experience of tech😄😄.
My Twitter Profile: